Propagation
Audio Examples
Here are some very short audio examples of meteor scatter:
Two doubles which are subsequent pings of different (but locally near-by) stations scattered by the same meteor trail,
and a twin-double. A twin is a pair of two meteors flying at very narrow distance from each other.
They are separated by fragmentation of a larger particle.
Download double1.wav
Download double2.wav
Download twindouble.wav
The author made several programs for aurora and meteorscatter.
In both cases, the specific geometry of the scattering process allows a precise prediction of the footprint of a transmission from a given location to a given scatterer.
Additionally there are some tools for TEP-conditions and for EME.
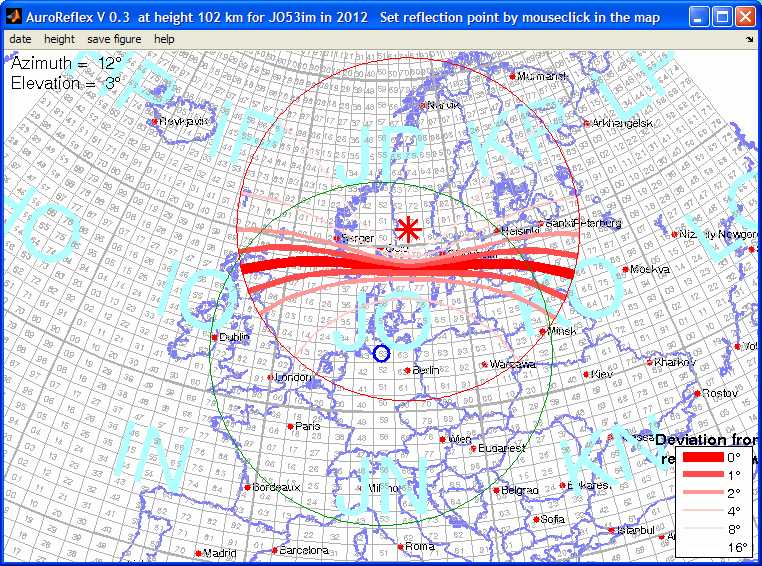
auroreflex
A program that shows the area that can be contacted via aurora/FAI for a given scatter location.
Output examples are in DUBUS 4/2004 p.40 Fig.3/4 and in CQ DL 1-2005, p.19, Bild 4/5.
The program does work all over the world, but sorry, the coastline maps and city locations are missing outside Europe / Africa.
Surely, someone could add this.
In the followin example, the aurora scatterer was set by the mouse into Central Sweden (the red star).
The user's locator is that of the author, JO53im (blue circle).
Optimal reflection is given to stations located on the bold red bar from Northern Scotland to Western Russia.
I.E. the red bar is the footprint of a transmission from the blue circle to the red star.
 Download auroreflex.zip (2.2 MB)
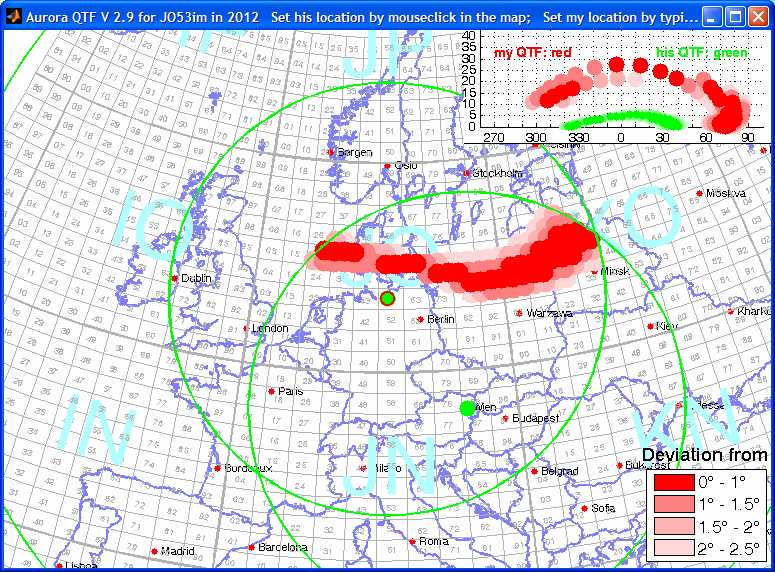
qtfgui V3.1
The inverse problem to the upper program auroreflex is solved by this program qtfgui:
It shows where the reflection areas for aurora/FAI and meteor scatter must be for a contact between two given locations.
Output examples are in DUBUS 4/2004 p.41/44/45/46 and in CQ DL 1-2005, p.18/19, Bild 2/3.
The program does work all over the world, but sorry, the coastline maps and city locations are missing outside Europe / Africa.
Surely, someone could add this.
The user's locator is a parameter, the other stations locations is selected by a mouseclick into the map.
 Download qtfgui.zip (2.2 MB)
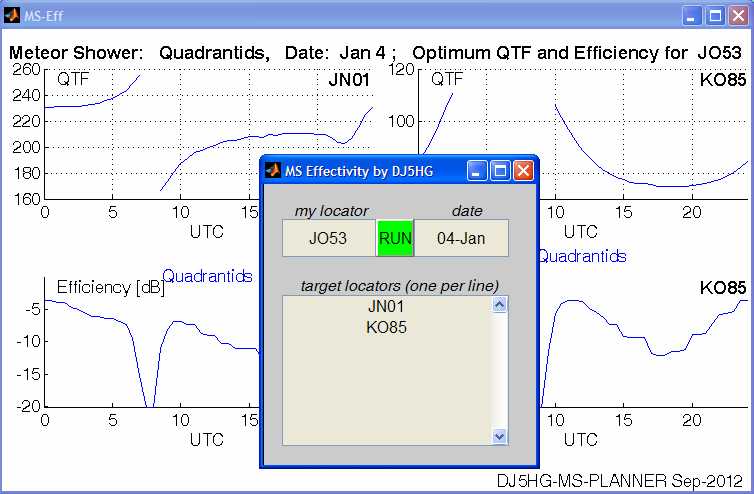
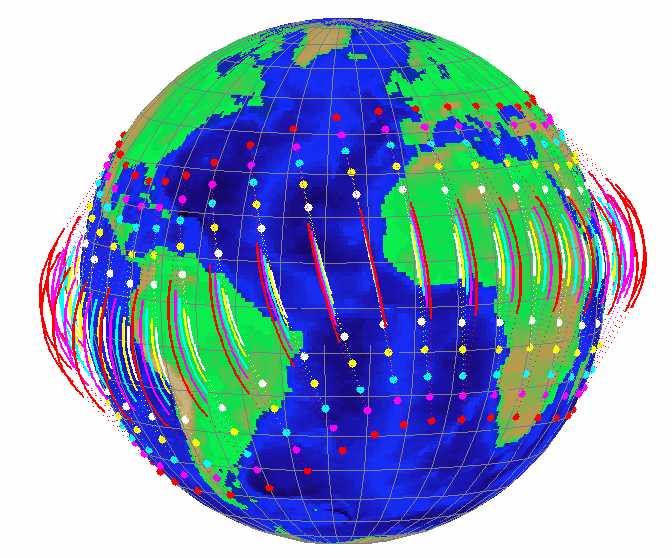
mseffectivity
This program computes diagrams of daily variation of QTF and meteorscatter efficiency for given date and Maidenhead locators at both ends.
(See also the ready-for-use MeteorScatter Effectivity Tables further down on this page)
 Download mseffectivity.zip (2.2 MB)
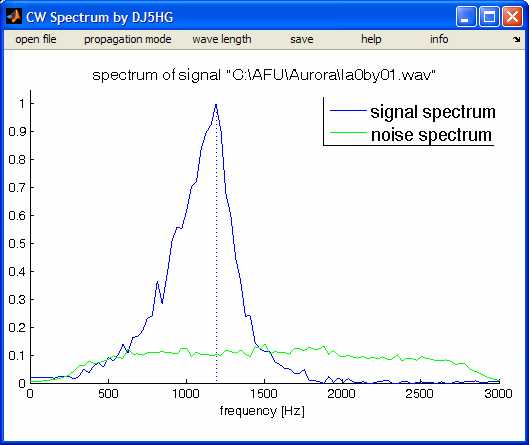
cwspectrum
This program uses the amplitude keying of the signal to differentiate between pure noise and noise plus signal.
The noise-spectrum is evaluated and subtracted from the spectrum of noise plus signal.
cwspectrum only accepts wave-files.
 Download cwspectrum.zip (2.6 MB)
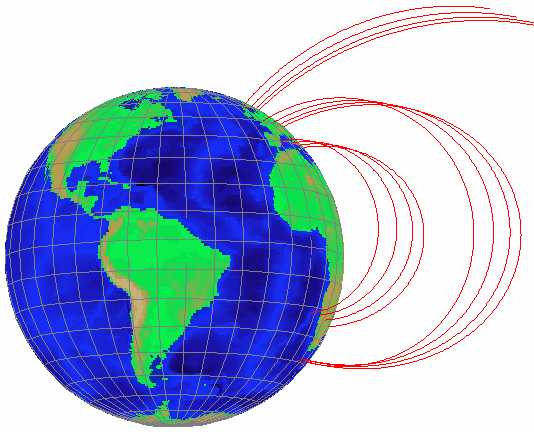
plotmfield
A program that generates a 3-D-image of the earth globe that can interactively be zoomed and rotated by the mouse.
You can add magnetic fieldlines wherever you want.
These field lines are computed based on the International Geomagnetic Reference Field (IGRF) at a date in the interval 1900 ... now.
 Download plotmfield.zip (2.2 MB)
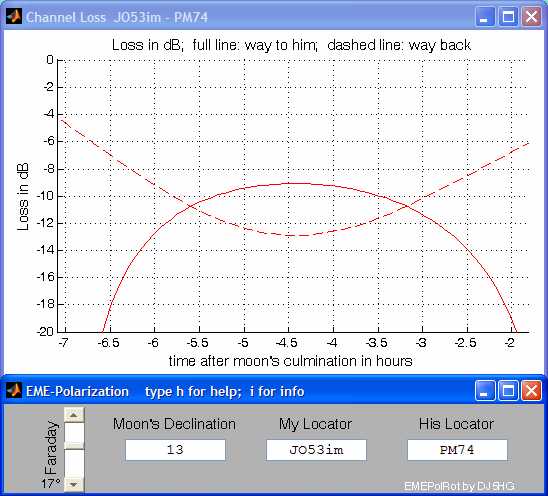
emepolrot
A program that demostrates the effect of polarization rotation by geometry and by the Faraday effect in EME contacts.
 Download emepolrot.zip (2.2 MB)
tepmodelgraph
A program that shows rotatable 3-D-images of the duct model for the Trans-Equatorial Propagation (TEP) in the years 1950 ... 2010.
The author does not prefer this model more than others.
The program simply is a tool for analysis and prediction of possible contacts.
 Download tepmodelgraph.zip (2.2 MB)
Go to the MeteorScatter Effectivity Tables
back to the Main Page